
135 of 242 Castes More Backward in Telangana, Survey Pushes Sub-Categorisation
In a first-of-its-kind exercise with far-reaching governance and political implications, the Telangana government’s Socio, Economic, Educational, Employment, Political and Caste Survey (SEEEPC) has presented a comprehensive and data-driven picture of the state’s social structure and inequality. Covering over 3.55 crore people across 1.12 crore households with 97.1 percent coverage , the survey stands as one of the most extensive socio-economic mapping efforts undertaken in India.
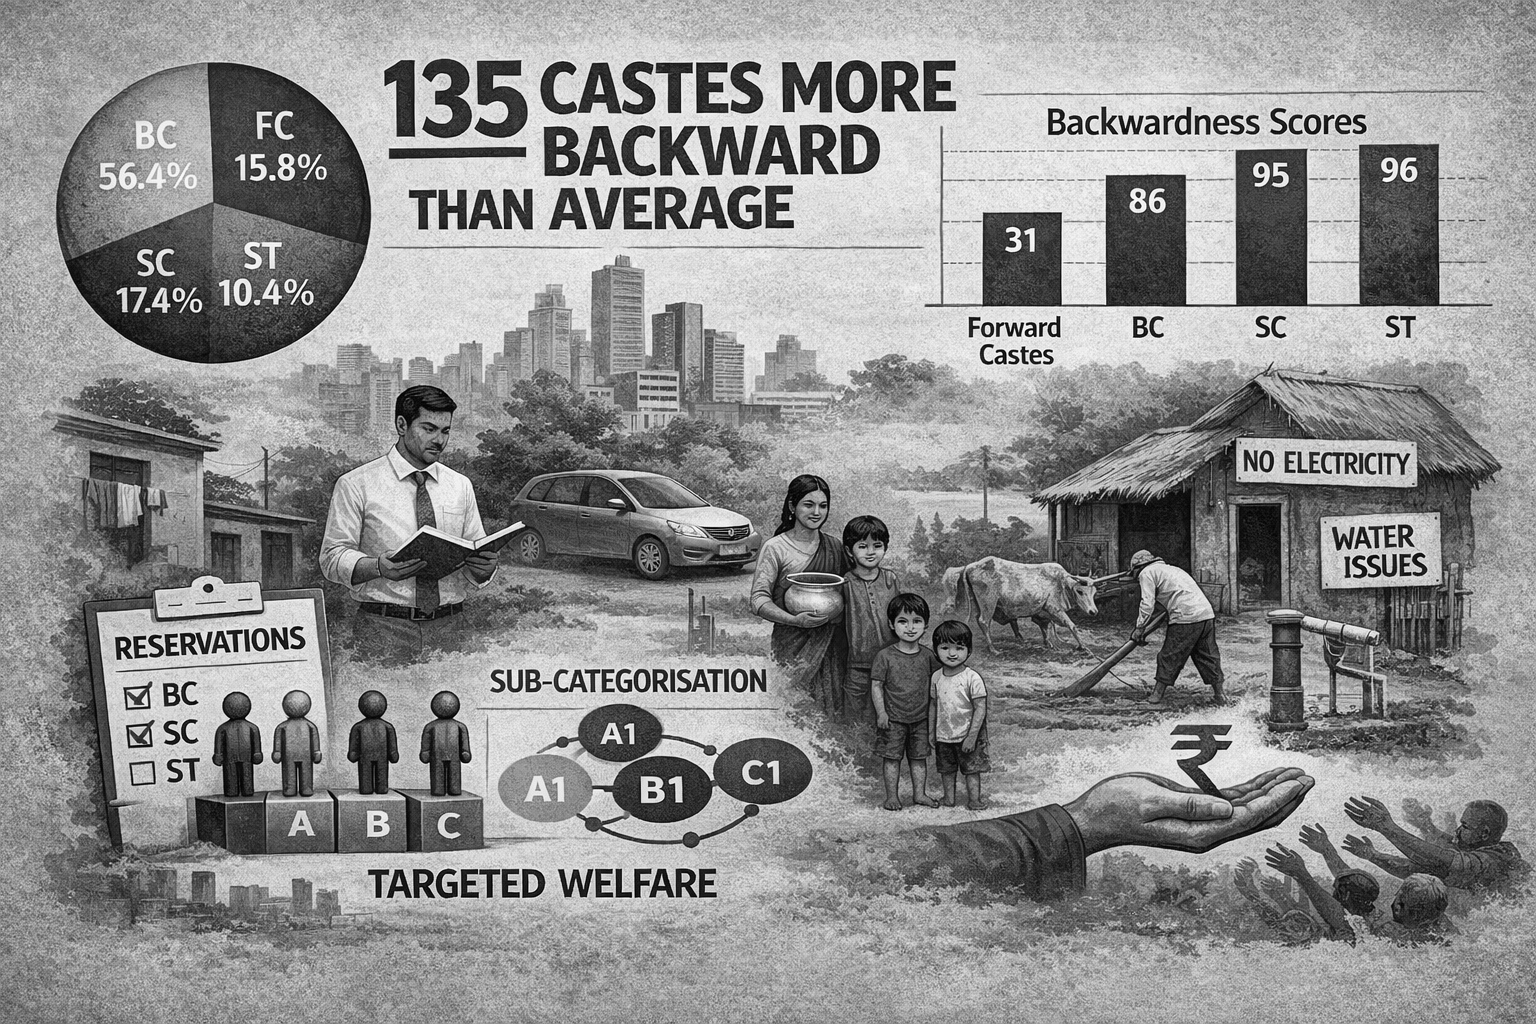
The findings reveal that Telangana has 242 caste groups , with 135 castes above backwardness average , accounting for nearly 67 percent of the population , with a Composite Backwardness Index (CBI) average of 81 . The demographic profile shows Backward Classes (56.36%) as the majority, followed by Scheduled Castes (17.43%) , Scheduled Tribes (10.45%) , and forward castes (15.79%) , while around 14 lakh people (4%) opted for the no caste category.
The survey’s caste-wise data highlights the dominance of a few large communities. Among the top groups, Madiga (36.58 lakh) emerges as the largest, followed by Shaik Muslim (27.96 lakh) , Mudiraj (26.39 lakh) , Lambadis/Banjara (24.04 lakh) , and Yadava (20.19 lakh) . Other major communities include Reddy (17.10 lakh) , Goud (16.30 lakh) , Mala (14.72 lakh) , and Munnurukapu (13.75 lakh) . The presence of No Caste (11.96 lakh) and Padmasali (11.82 lakh) also reflects changing social dynamics. Mid-sized communities such as Rajaka (9.96 lakh) , Kuruba/Kuruma (7.96 lakh) , Vaddera (6.44 lakh) , and Muslims (other groups) (6.33 lakh) further illustrate the layered caste composition. Smaller yet significant groups include Agnikulakshatriya (5.27 lakh) , Komati/Vaishya (5.09 lakh) , Nayi Brahmin (4.34 lakh) , Kummara (4.31 lakh) , Koya (4.28 lakh) , and Gond (3.82 lakh) . Among forward and influential castes, Kamma (3.68 lakh) , Brahmins (3.36 lakh) , Kapu/Naidu (2.42 lakh) , and Velama (1.44 lakh) remain numerically smaller but socially and politically significant. The distribution clearly shows that while a few castes have large population bases, many others remain fragmented.
A key insight from the survey is the uneven backwardness across and within communities. While SCs (96 score) and STs (95 score) are the most disadvantaged, BCs (86 score) show internal disparities, and forward castes, with a score of 31 , are relatively better placed. Among the most backward groups, 69 BCs, 41 SCs, and 25 STs fall above the state average, while 107 castes below average including 64 BCs, 18 SCs, 7 STs, and all 18 forward castes account for about 29 percent of the population , highlighting uneven distribution of development benefits.
The survey underscores a sharp rural-urban divide in living conditions. In rural areas, particularly among marginalised groups, households are more likely to live in kutcha housing , depend on firewood cooking , and lack access to basic infrastructure. Urban areas show better access to pucca housing and LPG , but inequality persists within cities. Statewide, 13.3% households lack toilets , rising to 32.5% among STs and 18.8% among SCs , compared to 4.5% among forward castes . Similarly, 5.8% households lack electricity (6.56 lakh families) , including 11% STs and 8.3% SCs , while forward castes stand at 2.7% . Access to drinking water remains uneven, with 21.2% households without piped water , affecting STs (21%) , BCs (20%) , and SCs (19.7%) more than forward castes ( 12.8% ).
Education and employment data reflect structural inequality. Marginalised communities show higher illiteracy and lower participation in higher education, while forward castes dominate in professional qualifications and English-medium education. Employment patterns indicate that SCs, STs, and sections of BCs are largely engaged in daily wage labour and informal sectors , whereas forward castes are more present in professional and business occupations , alongside a notable share of unemployment among vulnerable groups.
The survey also highlights widespread financial stress, with households borrowing for medical, education, agriculture, and social expenses , often relying on informal lenders. Asset ownership remains skewed, with land, housing, and vehicles concentrated among forward castes, while marginalised communities lag behind, reflecting deep-rooted economic inequality.
The findings make a strong case for targeted welfare and sub-categorisation , particularly within BCs, to ensure benefits reach the most deprived sub-groups rather than being unevenly distributed. Politically, the data is expected to reshape strategies, with BCs forming the majority and significant SC and ST populations influencing electoral outcomes through caste-based mobilisation and welfare expectations.
Overall, the SEEEPC survey serves as a blueprint for data-driven governance , highlighting the scale of inequality, the need for precision policymaking, and the importance of equitable distribution of resources to achieve inclusive development in Telangana.